The pyramid debug toolbar
The pyramid webserver comes with an integrated debug toolbar that offers a lot of information to ease development. To ease the development process in CubicWeb a series of custom debug panels have been developped especially for that purpose.
To use the pyramid debug toolbar in CubicWeb, you need to:
- install it either by doing a pip install pyramid_debugtoolbar or following the official installation instructions
- launch the pyramid command adding the -t/–toolbar argument to enable it like so: cubicweb-ctl pyramid my_instance -t (you probably want to add -D to activate the debug mode during development)
- navigate to the website and click on the icon on the right like on this screenshot:
And you’ll have access to the debug toolbar content for this page.
Custom panels
A series of custom debug panels have been written to offer more useful debug information during development. Here is the list:
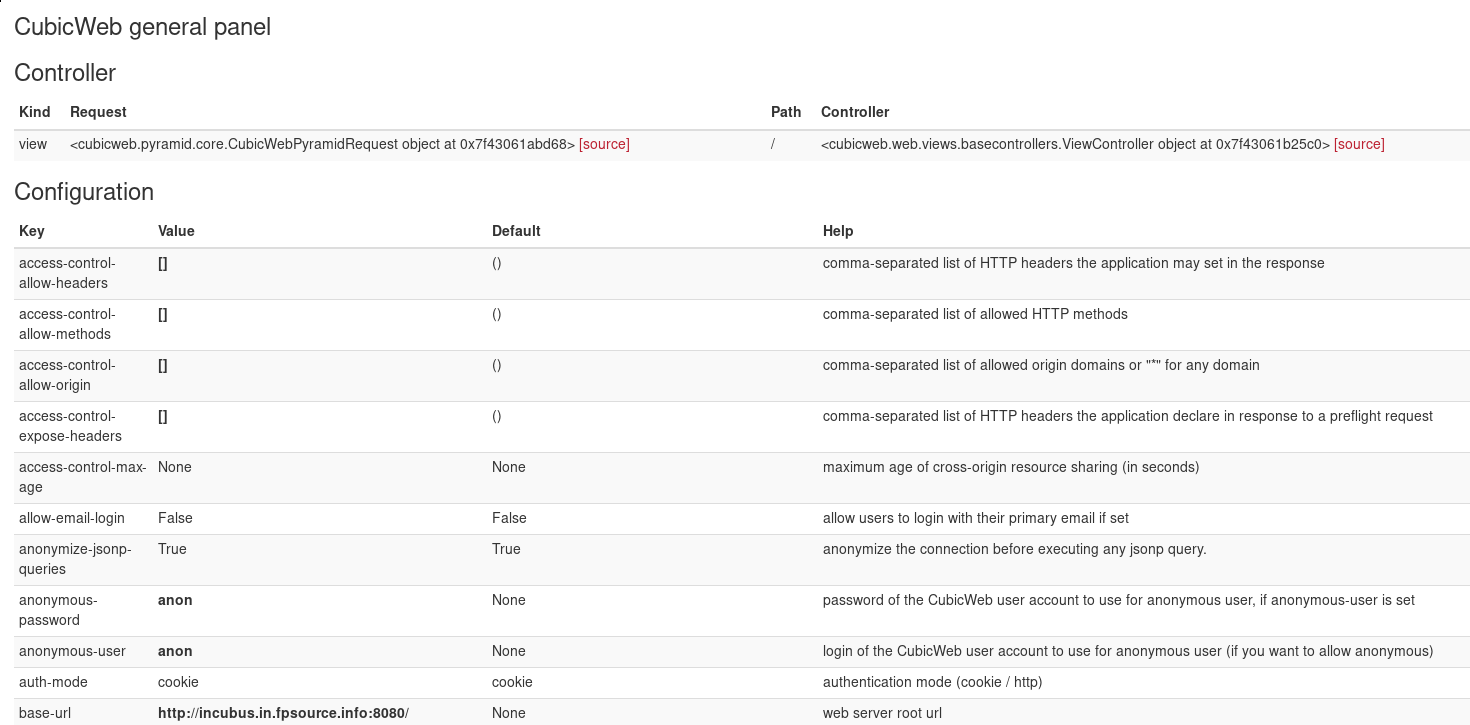
General ‘CubicWeb’ Panel
Provides:
- currently selected controller for this with and uri/requests information
- current instance configuration, options that differs from default ones are in bold
- a list of useful links like on the default CW home
Screenshot:
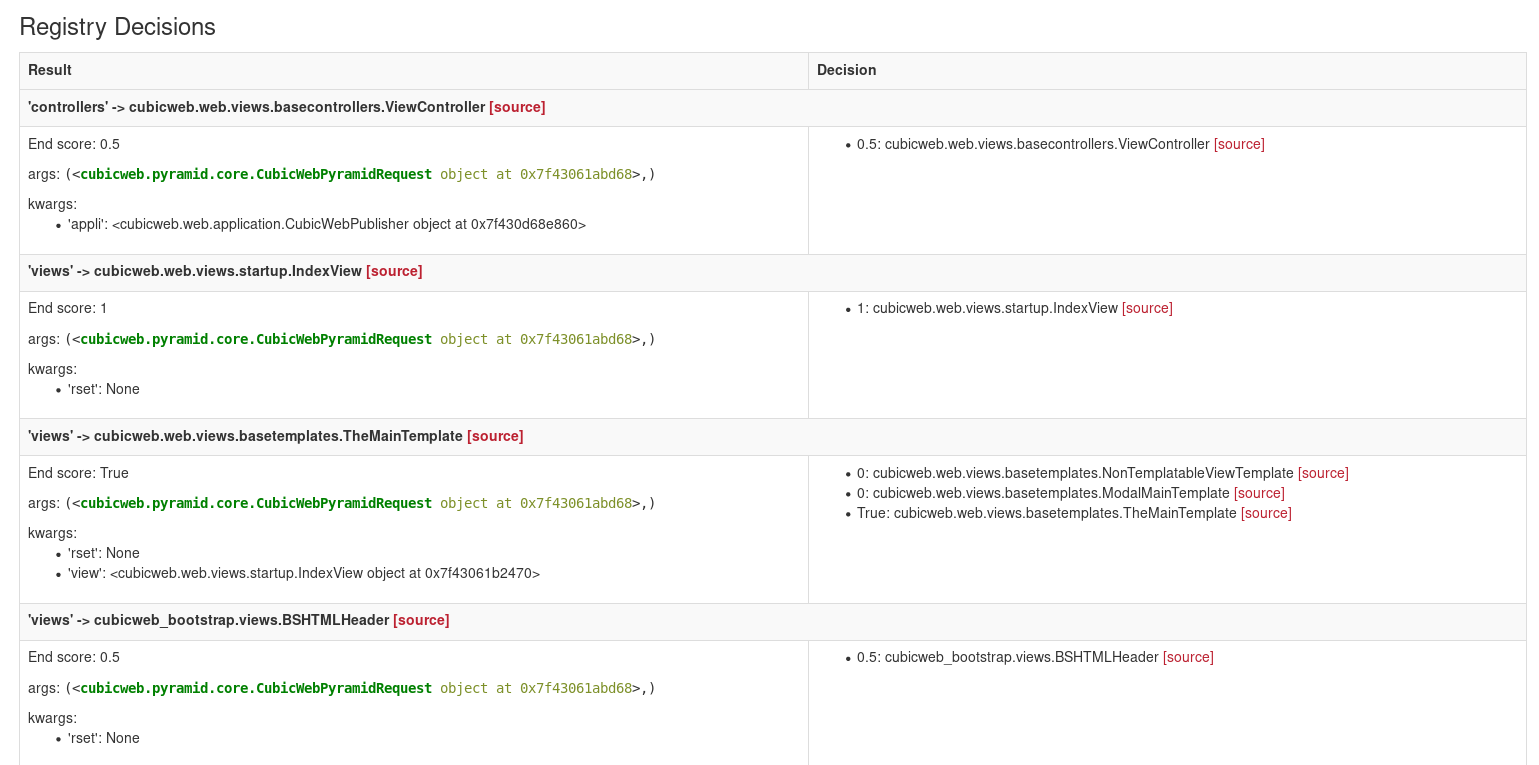
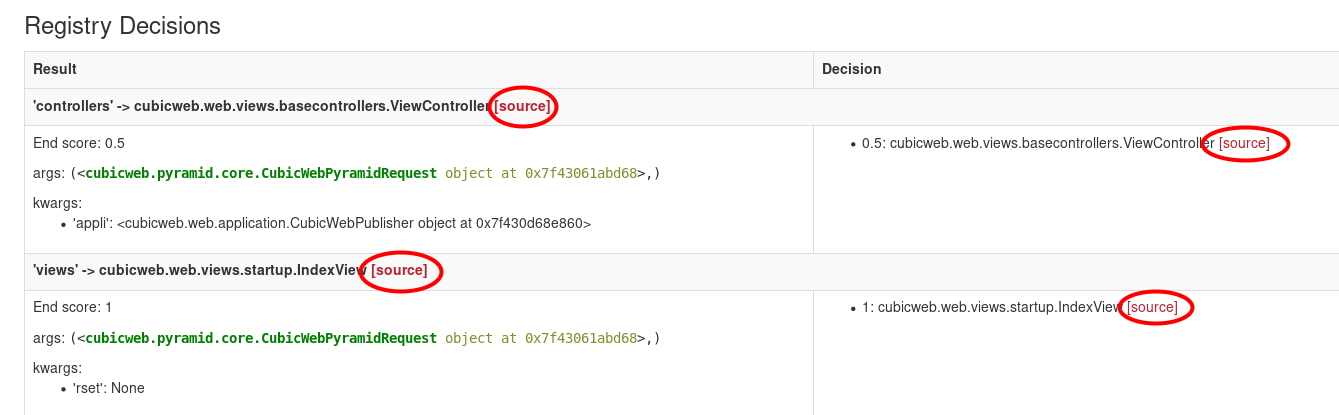
Registry Decisions Panel
Provides:
- a list of all decisions taken in all registry during this page construction
- the arguments given to take the decision
- all the selection entities during decisions with their score
- which one has won if any
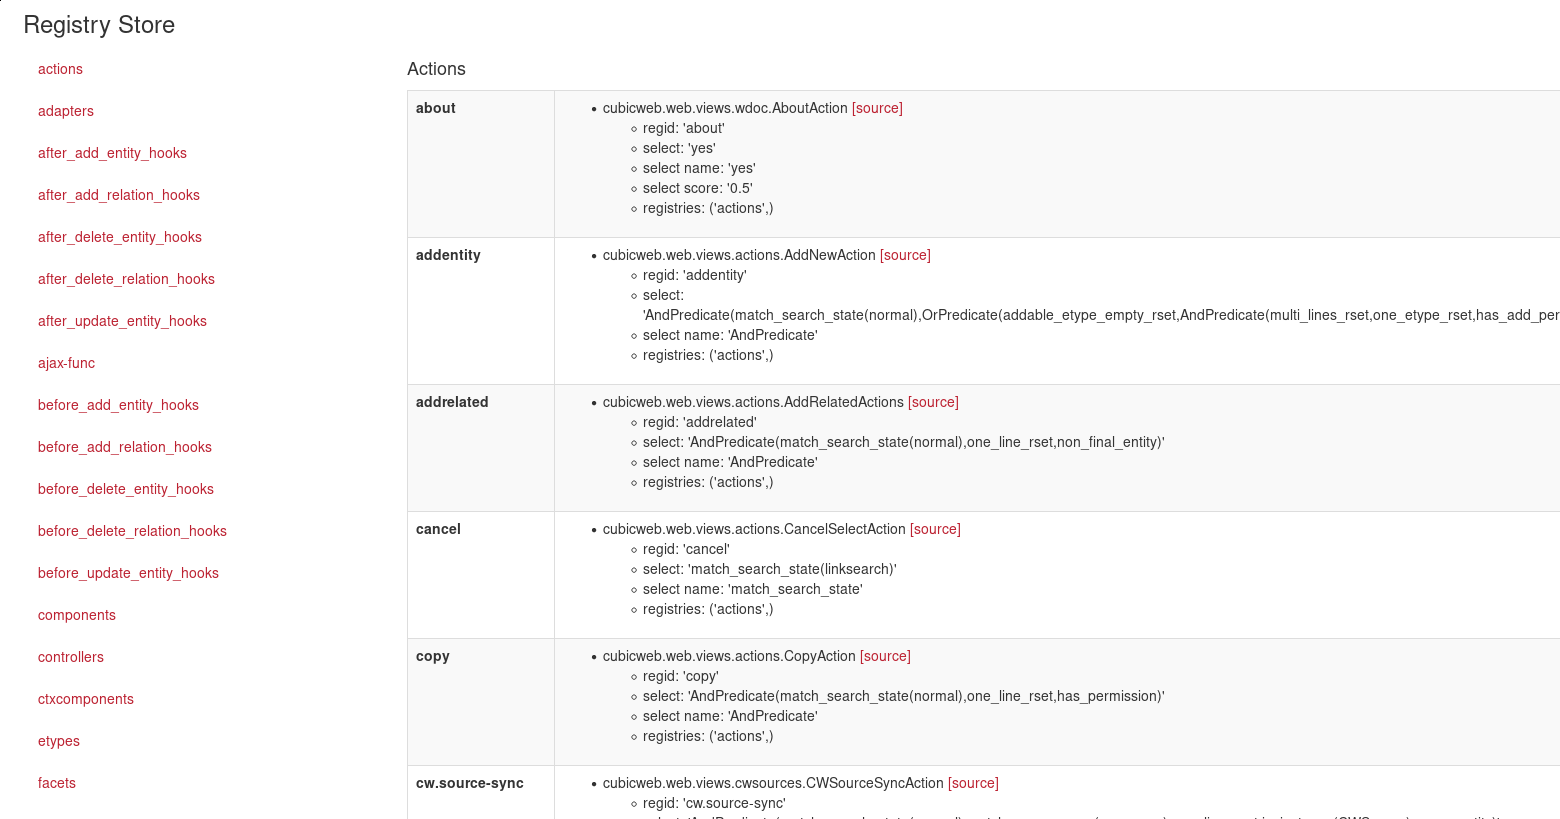
Registry Store
Provides:
- a listing of all the content of the different registries
- for each entity its detailed information
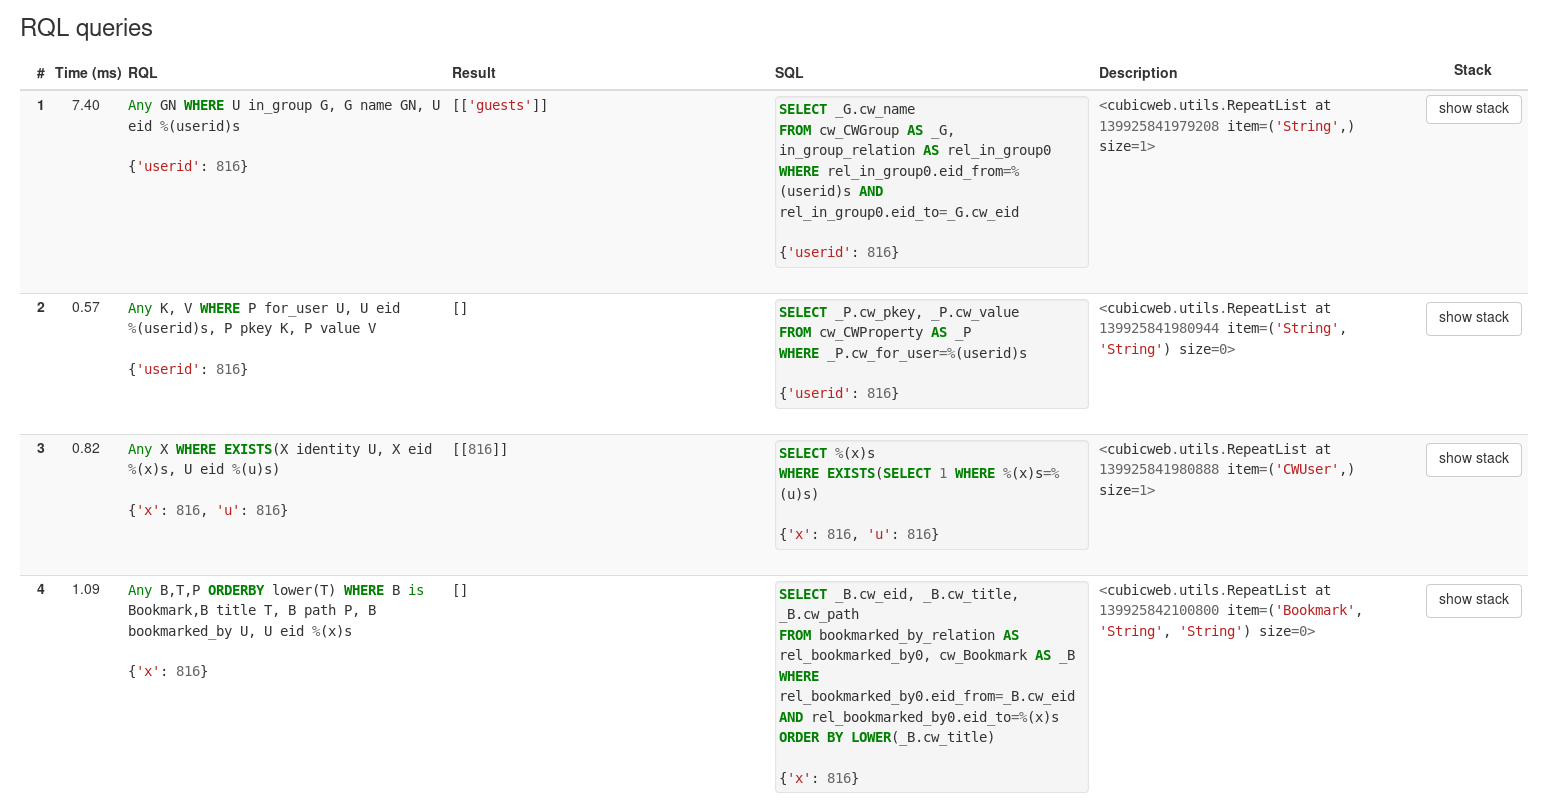
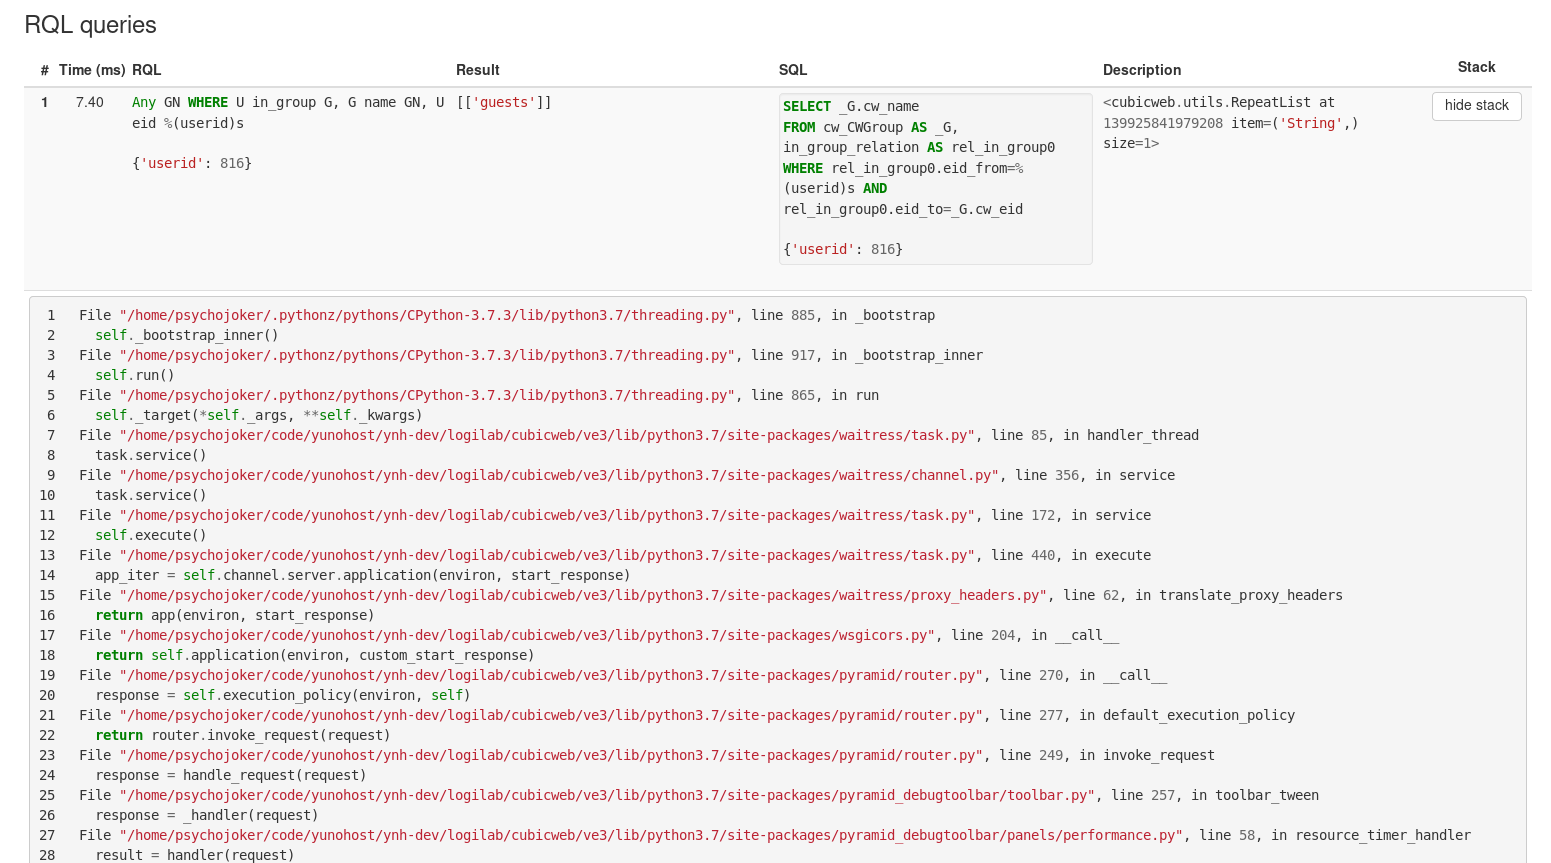
RQL
Provides:
- a list of all executed RQL queries during this page creation
- for each RQL query all the generated SQL queries
- detail information like the result, the args and the description of each query
- the call stack on each query to see where it has been called
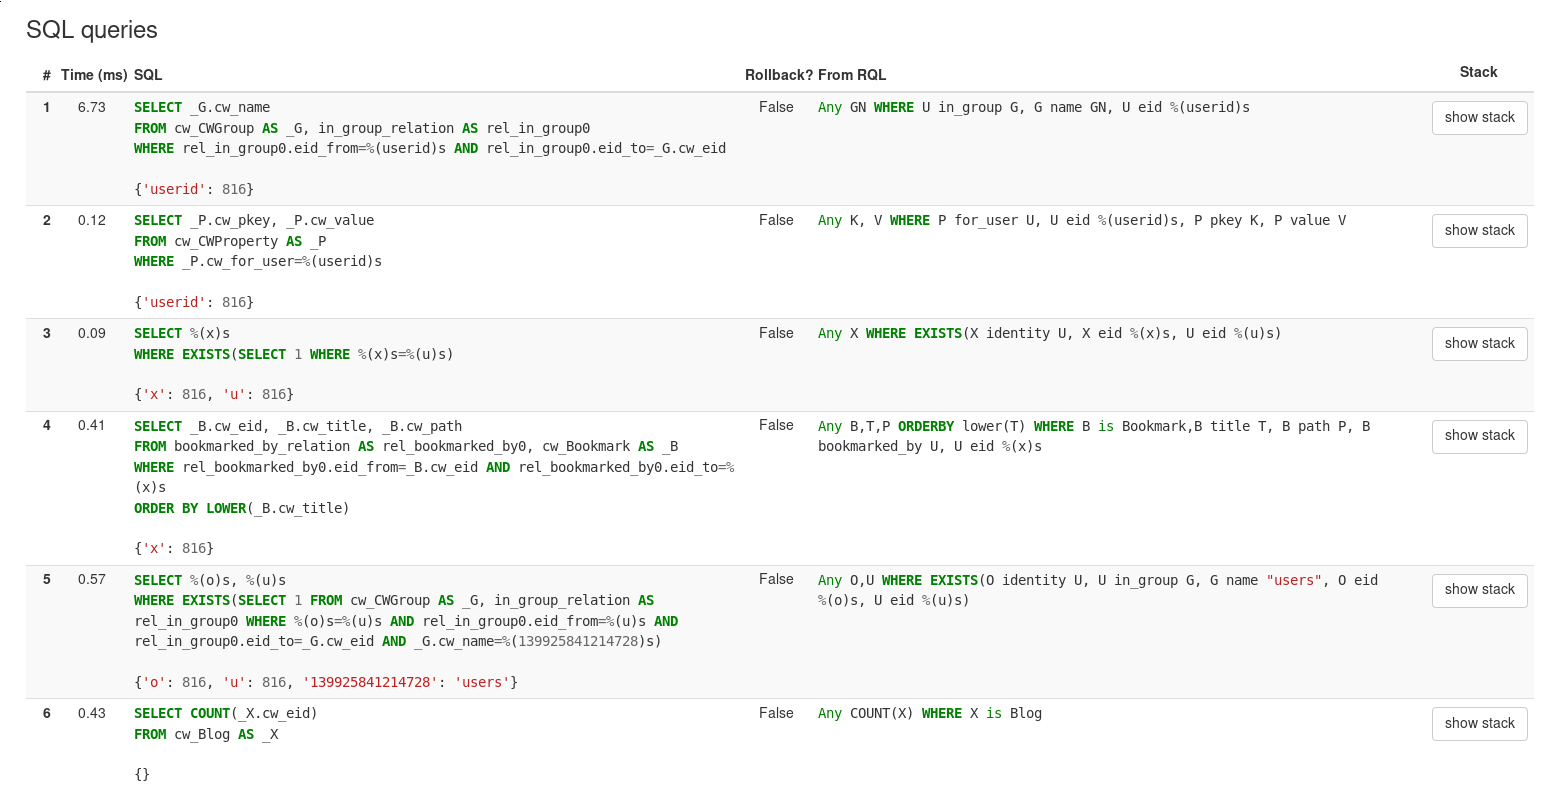
SQL
Provides:
- a list of all executed SQL queries during this page creation
- for each SQL query the RQL query that has generated it, if any (some aren’t)
- detail information like the result, the args and if the query has rollback
- the call stack on each query to see where it has been called
Accessing the sources of the class/functions/method listing the debug panels
A traversal of all those custom panels is the see the source code of all listing class/functions/methods. You can access those by:
- clicking on the [source] close to the target when available
- clicking on the file path in the traceback stack
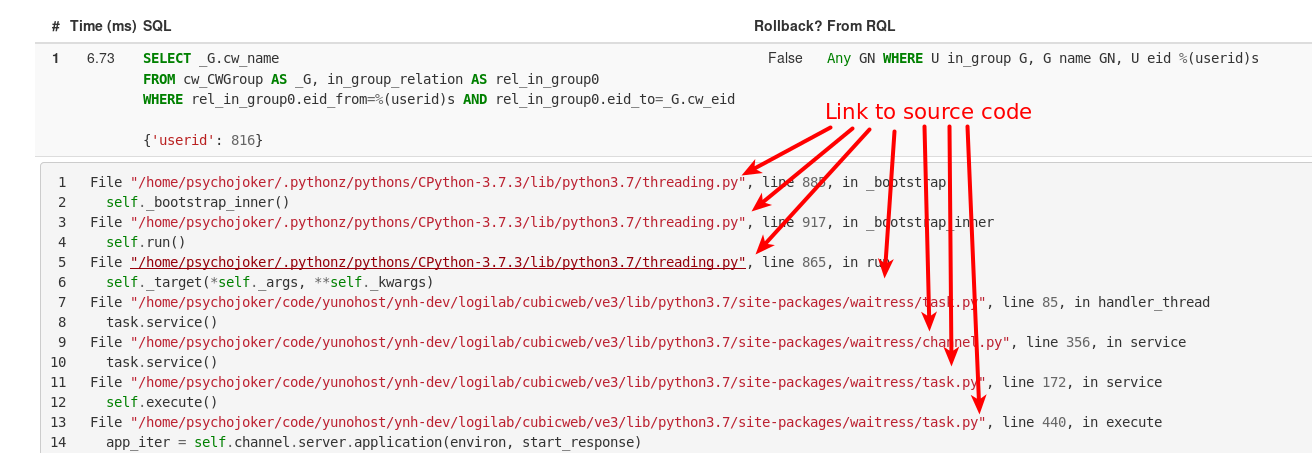
You be sent to a page looking like this:
Contributing
All source code for the custom panels is located here and the documentation of how to write custom toolbar panels here.